
In today’s fast-paced online world, having a high-performing and fast-loading website is crucial for user satisfaction and search engine rankings. Google Search Console is an invaluable tool for monitoring site speed and overall performance. This guide will walk you through the fundamentals of this powerful tool to help you boost your website’s performance and keep your users happy.
Introduction to Google Search Console
Introduction to Google Search Console: Monitoring Site Speed for General Public
Google Search Console is a powerful, free tool that enables you to monitor, maintain, and optimize your website’s performance on Google Search. One crucial aspect of your site’s performance is site speed, which plays a significant role in both user experience and Google’s search engine rankings. In this guide, we will provide an introduction to Google Search Console, explain how it works, and highlight its importance in monitoring your website’s speed.
1. What is Google Search Console?
Google Search Console (formerly known as Google Webmaster Tools) is a free service offered by Google that allows website owners, developers, and SEO professionals to monitor and analyze their site’s performance on Google Search. It provides valuable data and insights on critical aspects of a website, including:
- Index status and crawl errors
- Search traffic data (such as clicks, impressions, and position)
- Sitemaps submission and management
- Mobile usability and AMP status
- Core Web Vitals and site speed performance
- Security and manual actions
2. How does Google Search Console work?
To start using Google Search Console, you need to:
- Sign up: Create a free Google account or use your existing account to sign up for Google Search Console.
- Verify your website: Add your website to Google Search Console by entering your website domain or URL prefix and follow the instructions to verify your site’s ownership. You can do this through multiple methods such as uploading an HTML file, adding a DNS record, or using a Google Analytics or Google Tag Manager tracking code.
- Explore the features: Once you have verified your website, you can access different features and reports within Google Search Console. These help you understand your site’s performance, discover potential issues, and take action to improve your visibility on Google Search.
3. Why is monitoring site speed important?
Monitoring site speed is crucial for several reasons:
- User experience: A slow-loading website can lead to poor user experience, causing higher bounce rates and lower dwell time. Visitors are more likely to leave your site and return to search results if your site takes too long to load.
- SEO ranking factor: Google uses site speed as a ranking factor in its search algorithms. Faster-loading websites are more likely to rank higher in search results than slow-loading ones.
- Mobile-first indexing: With mobile-first indexing, Google prioritizes the mobile version of your website in its indexing and ranking systems. As mobile devices usually have slower internet connections, a fast-loading, mobile-friendly site is essential for optimal search performance.
4. How to monitor site speed with Google Search Console?
Google Search Console provides a specialized report to measure site speed called the Core Web Vitals report. This report assesses your site’s performance based on three metrics: Largest Contentful Paint (LCP), First Input Delay (FID), and Cumulative Layout Shift (CLS).
To access the Core Web Vitals report, follow these steps:
- Log in to your Google Search Console account and select your verified website.
- On the left-hand menu, click on “Core Web Vitals” under the “Experience” section.
- The report displays data for both mobile and desktop performance. It segregates URLs into three categories based on their performance: “Poor,” “Needs improvement,” and “Good.”
By exploring the Core Web Vitals report in Google Search Console, you can identify the areas where your site needs improvement and take necessary actions to enhance your site’s speed and overall performance.
Conclusion:
Google Search Console is an essential tool for any website owner, providing valuable insights and actionable data to improve your site’s performance on Google Search. Monitoring site speed is a crucial aspect of maintaining a user-friendly, SEO-friendly website. By regularly checking and acting upon the data found in Google Search Console’s Core Web Vitals report, you can ensure that your site remains as fast-loading and responsive as possible for your visitors.
Creating and Verifying Your Account
Step 1: Create a Google Account
Before you can use Google Search Console, you’ll need to sign up for a Google Account if you don’t already have one. Here’s how:
- Visit the Google Account creation page (https://accounts.google.com/signup)
- Enter your first and last name.
- Choose a username for your new email address. This will be yourname@gmail.com.
- Create a strong password, and enter it in the “Password” and “Confirm Password” fields.
- Provide your birthdate and gender.
- Optional: Provide your mobile phone number, which can help with account security.
- Click “Next” to finish creating your account.
Step 2: Set up your Google Search Console Account
- Visit the Google Search Console website (https://search.google.com/search-console)
- Click “Start Now” if you’re not already logged into your Google Account. If you are logged in, proceed to the next step.
- On the Google Search Console home page, click “Add a property.”
- Select the “URL prefix” option and enter the full URL of the website you want to monitor. For example, https://www.example.com. Make sure to include “http://” or “https://” depending on your website’s structure. Click “Continue.”
Step 3: Verify Your Website Ownership
To use Google Search Console, you must prove that you own the website you want to monitor. There are different methods to verify your site, but we’ll cover the most common one, which is “HTML file upload.”
- Download the HTML verification file provided by Google Search Console. The file will be named “googlexxxxxx.html,” where “xxxxxx” is a unique alphanumeric code.
- Using an FTP client or your web hosting control panel, upload the verification file to the top-level directory of your website. This is usually the same folder where your site’s index file (index.html, index.php, etc.) is located.
- Once the file is uploaded, return to Google Search Console and click on “Verify.”
- Google will attempt to find your verification file at the specified URL. If successful, you’ll see a confirmation message that your website has been verified. If not, double-check that you uploaded the file to the correct directory and verify again.
Congratulations!
You’ve successfully created and verified your Google Search Console account. Now, you can use the tool to monitor your site’s speed, performance, and other metrics to improve its search engine visibility and user experience.

Navigating the Dashboard
Step 1: Sign in to Google Search Console
- If you haven’t already, create a Google account or sign in with your existing credentials at https://search.google.com/search-console
- After signing in, add your website property by entering your site’s URL and clicking “Add property.” Verify your ownership of the site following Google’s instructions.
Step 2: Access the Dashboard
Upon verifying your site, you’ll be taken to the Google Search Console dashboard. This is where you can monitor and manage your site’s search performance and user experience.
Step 3: Familiarize yourself with the Dashboard layout
On the left side of the page, you’ll find a menu with several options, such as Overview, Performance, URL Inspection, Core Web Vitals, and more. These individual tools and features will help you monitor your site’s overall performance and address any issues related to site speed.
Step 4: Explore the Overview section
In the “Overview” section, you’ll see a snapshot of your website’s search performance, including impressions, clicks, and your site’s average position in Google search results. You’ll also see a section for any enhancement or coverage issues identified by Google.
Step 5: Dig deeper with the Performance report
Click on “Performance” in the left-hand menu to access a more detailed report. Here, you can view search performance stats such as total clicks, total impressions, average click-through rate, and average position over different time frames.
Step 6: Inspect URLs with the URL Inspection tool
The “URL Inspection” tool allows you to check the indexing status of individual URLs on your site and identify any potential issues, as well as get recommendations for improvement. Enter a URL from your site into the search bar at the top of the page to analyze it.
Step 7: Monitor Core Web Vitals
Core Web Vitals are essential metrics for monitoring site speed and user experience. Click on the “Core Web Vitals” tab in the left-hand menu to access reports on your site’s performance in these areas.
Step 8: Investigate other tools and features
Explore the other options in the left-hand menu to get a better understanding of your site’s overall health, user experience, and discover new insights to improve performance. Some notable tools include the “Mobile Usability” section for analyzing your site’s mobile-friendliness, and the “Security & Manual Actions” section for detecting and addressing security issues or penalties affecting your site.
Step 9: Set up email notifications
To stay up-to-date with any issues or alerts related to your site, set up email notifications through your Google Search Console account settings. This way, you’ll be notified when any problems occur, allowing you to address them promptly.
Step 10: Regularly monitor dashboard
To keep your site performing well and to stay on top of any issues related to site speed and user experience, regularly visit the Google Search Console dashboard. Routinely analyze your site’s performance, investigate issues, and implement the recommended improvements to ensure optimal performance and user satisfaction.
Understanding Core Web Vitals
Understanding Core Web Vitals: The Key to Successfully Monitoring Site Speed with Google Search Console
Core Web Vitals are a set of website performance metrics that Google uses to evaluate a site’s user experience. With a better understanding of these metrics, you can ensure optimal site performance and improve your Google search rankings. In this article, we’ll explore Core Web Vitals, their significance for website performance, and their role in monitoring site speed with Google Search Console.
What are Core Web Vitals?
Core Web Vitals are a group of three key performance metrics that measure the loading, interactivity, and visual stability of a web page. These metrics are:
- Largest Contentful Paint (LCP): This measures the time it takes for the largest content element on the screen to fully load. A good LCP score is anything below 2.5 seconds.
- First Input Delay (FID): This measures the time it takes for the browser to respond to the user’s first interaction, like clicking a button or link. A good FID score is below 100 milliseconds.
- Cumulative Layout Shift (CLS): This measures how much elements on the page move around as the page loads, causing an unstable and visually distracting experience. A good CLS score is below 0.1.
Why are Core Web Vitals important for site performance?
Understanding and improving your site’s Core Web Vitals scores can result in numerous benefits, including:
- Better user experience: A good load time, responsiveness, and visual stability will create a more enjoyable browsing experience for your users.
- Improved search rankings: Google considers Core Web Vitals when determining search rankings, with higher-performing sites ranking higher on search engine results pages (SERPs).
- Increased site traffic: Higher search rankings and a better user experience can lead to more visitors and, ultimately, higher conversion rates.
How to monitor site speed with Google Search Console
To effectively monitor your site’s speed and Core Web Vitals using Google Search Console, follow these steps:
- Sign into your Google Search Console account. If you don’t have an account, set one up by following Google’s instructions.
- Add your site to Google Search Console by entering the website’s URL and verifying ownership.
- Once your site is set up within Google Search Console, navigate to the “Enhancements” section in the left-hand menu and click on “Core Web Vitals.”
- In the Core Web Vitals report, you will see separate tabs for mobile and desktop results. Click on each tab to view the LCP, FID, and CLS scores for your site. Analyze the report to identify any areas in which your site’s performance may be lacking.
- Click on the individual metric scores to see more details and uncover specific issues that need addressing. Google will provide recommendations for improving your site’s performance, which may include optimizing images, removing unused JavaScript, or minimizing CSS.
Continuous monitoring and improvement
- Regularly review your Core Web Vitals report in Google Search Console and follow the provided recommendations to improve your site’s performance.
- Test design and performance changes to your site using Google’s PageSpeed Insights or Lighthouse, which can provide additional insights on how to optimize your site.
- Keep an eye on your competitors’ performance and make adjustments to ensure your site remains competitive in terms of user experience and search engine rankings.
Understanding and optimizing Core Web Vitals is crucial for maintaining a high-quality user experience and ensuring success in search rankings. By monitoring these metrics with Google Search Console, you can take control of your site’s performance and make informed decisions on how to improve its overall speed and stability. Continuous monitoring and improvement will help you stay ahead of the competition and drive success for your online presence.

Using Performance Reports
Using Performance Reports in Google Search Console
Step 1: Sign in or Sign up for Google Search Console
1. Visit the Google Search Console website at https://search.google.com/search-console/about.
2. Click the “Start Now” button.
3. If you don’t have a Google account, click “Create an account” to sign up for a Google account.
4. If you have a Google account, sign into your Google account. You will be redirected to the Google Search Console dashboard.
Step 2: Add and Verify your Website
1. Click “Add a property” located in the top left corner of the dashboard.
2. Type in your website URL (e.g., https://www.example.com) and click “Continue.”
3. Follow the on-screen instructions to verify your website ownership. You may choose from multiple verification methods such as using Google Analytics, Google Tag Manager, or uploading an HTML file to your website.
4. Once your website is verified, you will be able to access its data within Google Search Console.
Step 3: Access Performance Reports
1. On the Google Search Console dashboard, click on the property (website) you want to monitor.
2. In the left-hand menu, click on “Performance.” This will open the Performance report for your website.
Step 4: Interpret Performance Reports
The Performance report consists of several sections that provide information about your website’s performance in Google search results.
Overview
At the top, you will see a summary of your website’s performance metrics, including Total Clicks, Total Impressions, Average Click-Through Rate (CTR), and Average Position. These metrics provide an overall picture of your website’s visibility and user engagement in Google search results.
Graph
Below the overview, you will see a graph that shows the trend of your website’s performance metrics over time. You can hover your mouse over the data points to get specific values for each metric on specific dates. Use the graph to analyze how your website’s performance changes over time and identify any patterns or anomalies.
Queries, Pages, Countries, Devices, and Search Appearance
In these sections, you will find a breakdown of your website’s performance by different dimensions. The data is presented in tables that display metrics like clicks, impressions, CTR, and position for each dimension.
- Queries: Analyze which search terms are driving the most traffic to your website and their respective performance metrics.
- Pages: Identify the high-performing and low-performing pages on your website to improve your site’s overall performance.
- Countries: Understand which countries your website’s visitors come from and their corresponding performance metrics.
- Devices: Observe the distribution of your website’s traffic across different devices (desktop, mobile, tablet) and their respective performance metrics.
- Search Appearance: Evaluate the performance metrics of specific search result features, such as rich snippets or accelerated mobile pages (AMP).
Step 5: Customize the Date Range and Compare Results
1. Above the graph, click on the “Date range” dropdown menu.
2. You can select a predefined date range (e.g., last 7 days, last 3 months) or create a custom date range using the calendar tool.
3. You can also compare two date ranges to analyze your website’s performance over time and identify any improvements or declines.
Step 6: Export Performance Data
To further analyze your website’s performance data in external tools, you can export the data from Google Search Console.
- 1. At the top of the Performance report, click on the “Export” button.
- 2. Choose between exporting the data in CSV format (for spreadsheet programs like Microsoft Excel or Google Sheets) or Google Sheet format.
- 3. Once you have exported the data, you can analyze it using various data visualization and analysis tools to gain deeper insights into your website’s performance.
By continually monitoring your website’s performance through Google Search Console, you can identify opportunities for optimization and improvement, leading to better site speed and user experience.

Analyzing Page Load Speed
Analyzing Page Load Speed: How to Use Google Search Console to Monitor Site Speed
Google Search Console is a valuable tool for webmasters, providing insights into how their websites are performing in Google search results. One of the key metrics available in Google Search Console is page load speed, which can have a significant impact on user experience and website rankings. Here’s how to use Google Search Console to monitor your website’s load speed and identify areas for improvement.
Step 1: Set up Google Search Console
- If you haven’t already, sign up for a Google Search Console account. Go to https://search.google.com/search-console/about and click “Start Now.”
- Sign in with a Google account, or create one if you don’t have one already.
- Once you’re signed in, add your website as a new property by clicking the “Add property” button and entering your website’s URL.
- Verify your website by following the on-screen instructions. This may involve adding a meta tag to your website’s code or uploading a specific HTML file to your server.
Step 2: Access the Core Web Vitals report
- From the Google Search Console dashboard, navigate to the “Experience” section in the left-hand menu.
- Click on “Core Web Vitals” to open the report.
Core Web Vitals are performance metrics created by Google, which measure the load time, interactivity, and stability of web page content. These metrics provide insights into how fast your website loads for users.
Step 3: Analyze your website’s page load speed
The Core Web Vitals report provides two separate sections: one for mobile statistics and one for desktop. These sections display the following information:
- Percentile: Measures your website’s overall performance. Ideally, you should aim for 75% or higher.
- LCP (Largest Contentful Paint): Measures the loading speed of your website; in other words, how long it takes for the largest item to appear on the page. A “good” score is under 2.5 seconds.
- FID (First Input Delay): Measures the time it takes for a user’s first interaction with your website; for example, clicking a button. A “good” score is under 100 milliseconds.
- CLS (Cumulative Layout Shift): Measures the stability of elements on a page as it loads. A “good” score is under 0.1.
Take note of any areas where your website falls short of Google’s “good” benchmarks. These are areas you should prioritize for improvement.
Step 4: Use the report to identify specific URLs with performance issues
Click on “Open Report” for either the mobile or desktop sections to see a more detailed breakdown of your website’s performance issues. This report will list URLs with poor performance, allowing you to pinpoint which pages need the most attention.
Step 5: Implement improvements and monitor progress
Once you’ve identified the problem areas, work on implementing improvements to your website’s speed. Common optimizations include compressing images, minifying JavaScript and CSS files, and leveraging browser caching.
After making these changes, continue to monitor your site’s performance using the Google Search Console Core Web Vitals report. This will help you track your progress and ensure that your improvements are having the desired effect.
Remember that optimizing your website’s performance is an ongoing process. Aim to regularly audit your site’s speed and make adjustments as needed to provide the best possible user experience.
Implementing Speed Optimizations
Implementing Speed Optimizations: How to Optimize Your Website’s Speed and Improve Its Performance
A fast-loading and well-performing website is not only crucial for user experience but also essential for better search engine rankings. In this guide, you will learn how to monitor site speed with Google Search Console and implement various optimization methods to improve your website’s overall performance.
Set up and utilize Google Search Console
-
Sign up or log in to Google Search Console with your Google account.
-
Add your website by clicking on “Add a property” and enter your website’s URL.
-
Verify your ownership of the website by following the steps provided by Google Search Console.
-
Navigate to the “Core Web Vitals” report under the “Experience” section to analyze your site’s speed and overall performance.
Optimize images
-
Compress and resize images without compromising quality by using tools such as Photoshop, TinyPNG, or JPEGmini.
-
Use the appropriate image format, such as JPEG for photos and PNG for graphics.
-
Implement lazy loading to ensure the images load only when users scroll to them.
Reduce the number of HTTP requests
-
Combine and minify CSS, JavaScript, and HTML files.
-
Use CSS sprites to combine multiple images, reducing the number of requests made by your website.
-
Limit the use of external scripts and plugins, as they can slow down your site.
Leverage browser caching
-
Add Expires headers to inform browsers when they should request a file from your server or fetch it from the cache.
-
Configure your server to use caching headers like Cache-Control and ETag.
-
Utilize tools, such as W3 Total Cache (for WordPress), to manage caching settings efficiently.
Enable gzip compression
-
Compress your website’s files, such as HTML, CSS, and JavaScript, using gzip to reduce their size.
-
Check if your server supports gzip compression and enable it via .htaccess or server configuration files.
-
Test your website’s compression with online tools, such as the “Gzip Compression Test” by GiftOfSpeed.
Optimize CSS and JavaScript delivery
-
Ensure that critical CSS and JavaScript are loaded in the <head> section of your HTML file, while non-critical assets are deferred or asynchronously loaded.
-
Consolidate and minify CSS and JavaScript files to reduce their size and requests.
-
Use tools like UnCSS to remove unnecessary or unused CSS from your website.
Use Content Delivery Networks (CDNs)
-
Distribute and serve your website’s static resources (images, CSS, JavaScript) through a CDN to improve load time for users located far from your server.
-
Use popular CDNs, such as Cloudflare or Amazon CloudFront, to speed up your website’s content delivery.
Optimize your server’s performance
-
Choose a reliable and fast web hosting provider.
-
Keep your server software up to date, as updates often include performance improvements and bug fixes.
-
Implement server-side caching, such as Varnish or Memcached, to further enhance your website’s performance.
Monitor and test your website’s speed regularly
-
Utilize tools such as Google PageSpeed Insights, GTmetrix, or Pingdom to analyze your website’s performance and receive optimization suggestions.
-
Address the issues highlighted by these tools and periodically monitor your site’s speed to ensure consistent performance.
Conclusion
Implementing these various speed optimizations will significantly improve your website’s performance, resulting in better user experience and search engine rankings. By using Google Search Console and other performance analysis tools, you can keep track of your website’s speed and make necessary adjustments to maintain optimal performance.

Monitoring Changes and Improvements
Monitoring Site Speed with Google Search Console: A Step-by-Step Guide
Step 1: Access Google Search Console
To get started, you’ll first need to access Google Search Console. If you haven’t already, you’ll need to sign up for a free account. Visit https://search.google.com/search-console/about and click on “Start Now” to sign up or log in with your Google account.
Step 2: Add and Verify Your Website
Once you’re logged in, you’ll need to add and verify your website in Google Search Console. Enter your website URL and follow the onscreen instructions for verification. This may involve uploading a verification file to your website or adding a meta tag to your site’s HTML code. Once your site is verified, Google will start collecting data on its performance.
Step 3: Access the Performance Report
In the left-hand menu of Google Search Console, click on “Performance.” This will open the Performance report, which provides various metrics and data about your website’s visibility and performance in Google search results.
Step 4: Analyze Site Speed Metrics
To analyze the site speed metrics, click on the “Core Web Vitals” tab in the Performance report. This section will show you the site speed data for your website, indicating both loading times and visual stability. Core Web Vitals consists of three main metrics: Largest Contentful Paint (LCP), First Input Delay (FID), and Cumulative Layout Shift (CLS).
Step 5: Review Mobile and Desktop Metrics
Google Search Console provides separate data for both mobile and desktop users, as website performance can vary between devices. Be sure to review the metrics for both mobile and desktop to ensure a smooth user experience across all devices.
Step 6: Identify and Address Issues
The Core Web Vitals report will also show you the number of URLs that are deemed to be “Poor,” “Needs Improvement,” or “Good” based on the measured site speed metrics. Click on any of the categories to see a list of URLs with that particular site speed status. Address any issues to improve your website’s performance.
Step 7: Monitor Changes Over Time
Google Search Console provides historical data on your website’s performance over time. You can monitor this data to track the impact of any optimizations you’ve made. Use the date range filter at the top of the Performance report to view data from different time periods and gauge the effectiveness of your efforts.
Step 8: Implement Best Practices for Site Speed Optimization
To achieve the best possible site speed performance, be sure to follow site speed optimization best practices. This includes minifying JavaScript and CSS files, optimizing images, using browser caching, and implementing responsive design.
Step 9: Reassess and Continue Optimization
As you make changes to improve your website’s performance, continue to monitor your site speed metrics in Google Search Console. Regularly reassess your data and make any necessary adjustments to further optimize your site.
By following these steps, you can effectively monitor your website’s performance using Google Search Console while making data-driven improvements to your site speed. This will not only better the user experience of those visiting your site but may also positively impact your search engine rankings.
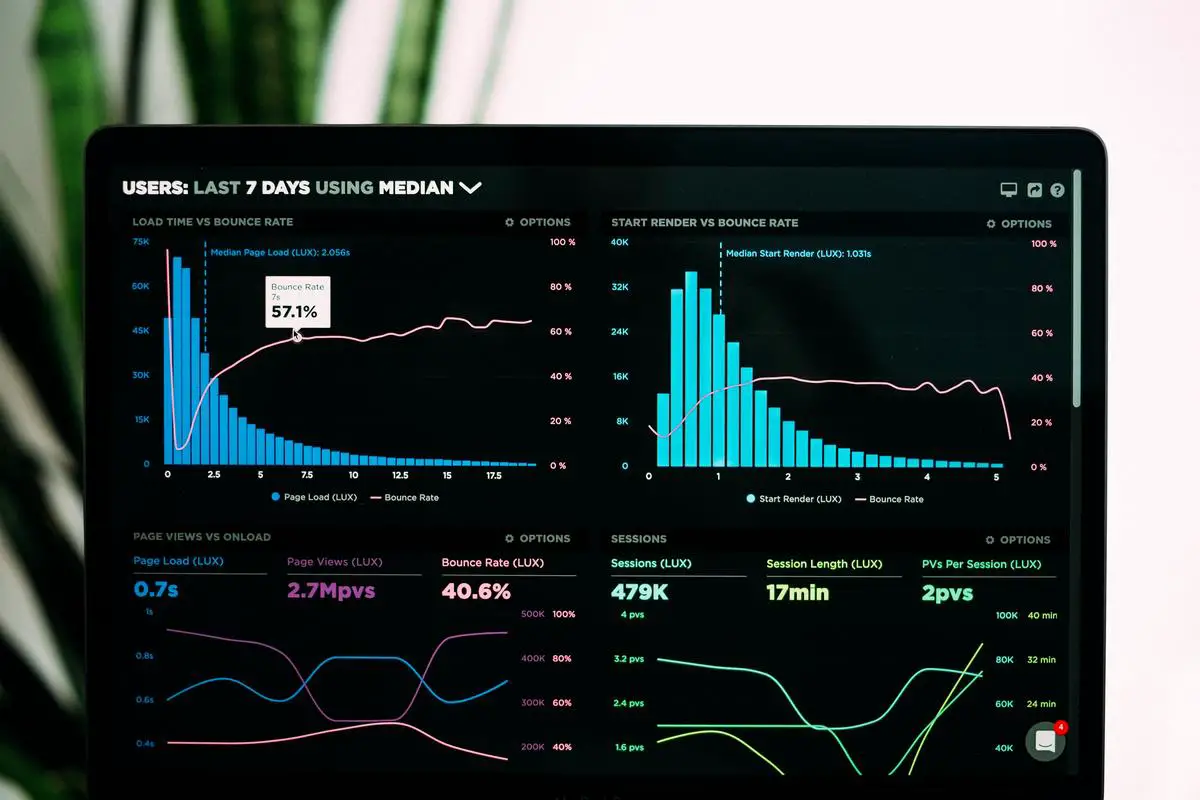
Photo by lukechesser on Unsplash
Troubleshooting Common Issues
Troubleshooting Common Issues: Monitoring Site Speed with Google Search Console
Monitoring site speed is crucial for a good user experience and can impact your search engine rankings. Google Search Console provides tools to help you analyze and improve your site’s performance. In this guide, we will explore how to troubleshoot and resolve common site speed and performance-related issues using Google Search Console.
Step 1: Access Google Search Console
- Go to Google Search Console (https://search.google.com/search-console) and sign in with your Google account.
- Add your website to Google Search Console if you haven’t already. Follow the on-screen instructions to verify that you own the site.
- Once your site is verified, click the “Open Report” button next to your site’s name to access the dashboard.
Step 2: Check Site Speed in Google Search Console
- On the dashboard, click on “Performance” in the left sidebar.
- Click on the “Speed” tab on the Performance page to view the Site Speed reports.
Step 3: Identify Issues and Opportunities
The Site Speed reports will help you identify specific issues that are affecting your site’s performance. The “Speed Score” represents a site-wide summary, while the “URL Performance” section provides more granular insights for individual pages. Look for high-impact issues and opportunities to improve site speed.
Step 4: Troubleshooting Common Issues
- Slow server response time: This issue can occur when your web server takes too long to send the initial HTML file to the browser. To resolve this issue, consider optimizing the backend code, implementing server caching, or upgrading your hosting plan.
- Large images and unoptimized media files: Heavy media files can cause slow page load times. To fix this issue, compress images and optimize video files using appropriate formats. Also, use an image CDN (Content Delivery Network) to serve images efficiently.
- Excessive use of JavaScript and CSS: Too many scripts or large CSS files can slow down your site. Minify and consolidate your JavaScript and CSS files, and use asynchronous loading for JavaScript files to improve performance.
- Multiple redirects: Having too many redirects can slow down your site as users are redirected multiple times before reaching the intended destination. To resolve this issue, eliminate unnecessary redirects and use a single direct link to your target page.
- Poorly optimized third-party content: Ads, analytics, and other third-party tools can slow down your site. Limit the use of third-party content and optimize it to improve site speed.
Step 5: Leverage Additional Tools
Google Search Console’s Site Speed reports provide a good starting point for identifying and resolving site speed issues. For more in-depth analysis and recommendations, use other tools like Google PageSpeed Insights (https://developers.google.com/speed/pagespeed/insights) and Google Lighthouse (https://developers.google.com/web/tools/lighthouse).
Conclusion
Monitoring site speed with Google Search Console is an essential step in resolving common performance-related issues. Perform periodic assessments, implement best practices, and make adjustments based on your analysis to ensure that your site’s speed and performance remain optimal.

By properly utilizing Google Search Console, you can be well-equipped to assess your website’s performance and identify areas for improvement. With the knowledge and tools gained from this guide, you’ll be ready to optimize your site’s load speed, enhance user experience, and ultimately improve your search engine rankings. So, go ahead and start monitoring your site’s speed today to give your users the best online experience possible.
