We all know that Q4 is the “good” season for ads, but will January Ad rates really be that much worse?
I hate to be the one to break it to you, but if you think ad rates are bad now, just you wait until we hit January 1st!
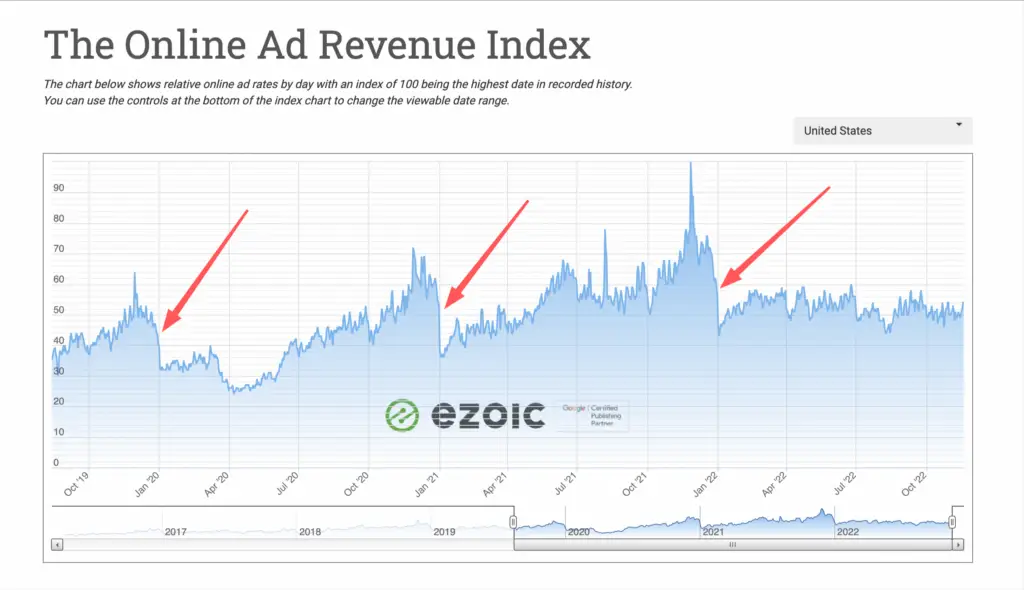
Every year, without fail we see January ad rates plummet. In 2019, ad rates dropped 50% from their Black Friday High, in 2020 it was a 49.3% drop and finally in 2021 it was a staggering 57% drop.
Advertisers, like consumers, spend a huge amount of their budget in November and December. When you think about it, a drop in rates makes perfect sense. Most Western consumerism holidays have come and gone. People by and large, are broke! Why advertise to people that have no money to spend?
Despite the fact ad rates have been somewhat depressed this year due to a multitude of factors (a lot of which I look at in this blog here, I still predict things to get worse before they get better (both for ads, and the world in general!)
Where can I see this data?
Great question. The tool that I use to keep on top of the average CPM across the industry is Ezoic’s ad revenue index. Remember, this in an index, so is a fluid chart. Each time there is a new highest RPM date, that will become the new 100 and everything else will move accordingly.

So if ad rates are going to be terrible, what should I do?
Firstly, being prepared for the drop is hugely important. Your content isn’t suddenly bad. Any and all snap decisions you make without all the information will always be a bad business decision. Understand this is part of the process and use your time wisely.
What can I do during this time to improve?
It’s a tough question to ask yourself, but this time of year is one we can either waste, or double down during. My top tip for this period of time is to look at your older content, and figure out what worked well, and where the opportunities for improvement lie. It’s my yearly reset time, and I find it incredibly cathartic.
I use Ezoic on my blogs, and their Big Data Analytics tool helps me to find opportunities I didn’t know existed.
Using category tags to understand what drives engagement.
I use meta tags to track my content. This is super useful as it allows me to see what works well, and what doesn’t!
In the image below you can see why this is so useful. Very quickly I can see which topics I write about drive the best RPM and Engagement. Given a choice between Local news or regional headlines, its easy to see which is more profitable! This will help me shape my content strategy moving forward!
Sports is another category that achieves high page RPMs – likely due to increased advertiser demand for this type of content. Engagement time is lower than the local news pages, but it is certainly still worthwhile building out content for this category as well. Something to consider!
Typically, most content writers will find that higher word count articles will drive higher earnings (page RPM). However, it is not always the case. For example, you can see on this site there are better engagement metrics and the highest Page RPM in the 500-750 word count bracket. Surprising, huh!
It would be a waste of time for me to write, or pay someone else to write, long articles for this website. When I discovered these insights, it freed me up so that I can focus on writing more short pieces to deliver what the audience wants at a higher profit.
These two tips alone are an excellent place to start. Sometimes being truly honest with yourself about the quality of your content will allow you to grow.
If this is useful, I will pull together a fully comprehensive checklist of my plan to be ready for the new year next time!

